5 minutes
JHB Property analysis
This notebook will contain analysis for the housing market of Johannesburg. (As of late 2018)
import pandas as pd
import numpy as np
import matplotlib.pyplot as plt
plt.style.use("ggplot") # Setting the style to ggplot (My personal pref)
%matplotlib inline
plt.rcParams['figure.figsize'] = [16, 8]
# Data Import
csv_path = r"C:\Users\mdjco\Desktop\Py\data_csv.csv"
df = pd.read_csv(csv_path)
Peaking our data
If we have a look at our data, we’ll see that some values are missing, and that the data type of the price column is not correct. Because the data was scraped from a website, some values might be missing - some might be incorrect.
print('Top 5 Rows of our data')
print(df.head())
print('\nDFrame info')
print(df.info())
Top 5 Rows of our data
          id                                          hyperlink  \
0  105991866  /for-sale/lenasia/johannesburg/gauteng/4699/10...
1  106821708  /for-sale/lenasia/johannesburg/gauteng/4699/10...
2  106822297  /for-sale/lenasia-south/johannesburg/gauteng/3...
3  106863873  /for-sale/glenvista/johannesburg/gauteng/5317/...
4  106863817  /for-sale/mid-ennerdale/johannesburg/gauteng/3...

            area                                               name  \
0        lenasia  4 Bedroom House for sale in Lenasia - Johannes...
1        lenasia  3 Bedroom House for sale in Lenasia - Johannes...
2  lenasia-south  4 Bedroom House for sale in Lenasia South - Jo...
3      glenvista  4 Bedroom House for sale in Glenvista - Johann...
4  mid-ennerdale     House for sale in Mid Ennerdale - Johannesburg

          price  bed  bath
0          None  4.0   3.0
1          None  3.0   4.0
2          None  4.0   2.0
3  2199000.0000  4.0   3.0
4   650000.0000  NaN   NaN

DFrame info
<class 'pandas.core.frame.DataFrame'>
RangeIndex: 5297 entries, 0 to 5296
Data columns (total 7 columns):
id           5297 non-null int64
hyperlink    5297 non-null object
area         5277 non-null object
name         5297 non-null object
price        5297 non-null object
bed          5173 non-null float64
bath         5173 non-null float64
dtypes: float64(2), int64(1), object(4)
memory usage: 289.8+ KB
None
Cleaning the Data
- We’ll have to set our price to the correct dtype
- We’ll set our id to the index
- We’ll Make sure that our data doesn’t contain duplicate houses (Each id should be unique)
- We’ll drop null values, just to make sure that empty values don’t scew the results
# Setting price to correct type:
df["price"] = pd.to_numeric(df["price"], errors="coerce") # Invalid parses, will be treated as NaN

# Dropping anything that is Nan, as well as duplicates
df = df.drop_duplicates(subset=["id"], keep=False).dropna()

# Setting the id as the index
df = df.set_index('id')
Confirming Data
df.info()
df.head()
<class 'pandas.core.frame.DataFrame'>
Int64Index: 4887 entries, 106863873 to 106680615
Data columns (total 6 columns):
hyperlink    4887 non-null object
area         4887 non-null object
name         4887 non-null object
price        4887 non-null float64
bed          4887 non-null float64
bath         4887 non-null float64
dtypes: float64(3), object(3)
memory usage: 267.3+ KB
| hyperlink | area | name | price | bed | bath |
|---|---|---|---|---|---|
| /for-sale/glenvista/johannesburg/gauteng/5317/… | glenvista | 4 Bedroom House for sale in Glenvista - Johann… | 2199000.0 | 4.0 | 3.0 |
| /for-sale/bassonia/johannesburg/gauteng/5246/1… | bassonia | 3 Bedroom House for sale in Bassonia - Johanne… | 8700000.0 | 3.0 | 1.0 |
| /for-sale/melrose/johannesburg/gauteng/5837/10… | melrose | 3 Bedroom House for sale in Melrose - Johannes… | 9450000.0 | 3.0 | 3.5 |
| /for-sale/lenasia-south/johannesburg/gauteng/3… | lenasia-south | 3 Bedroom House for sale in Lenasia South - Jo… | 1095000.0 | 3.0 | 2.0 |
| /for-sale/cyrildene/johannesburg/gauteng/5922/… | cyrildene | 3 Bedroom House for sale in Cyrildene - Johann… | 2399000.0 | 3.0 | 2.0 |
Making Observations based on our Data
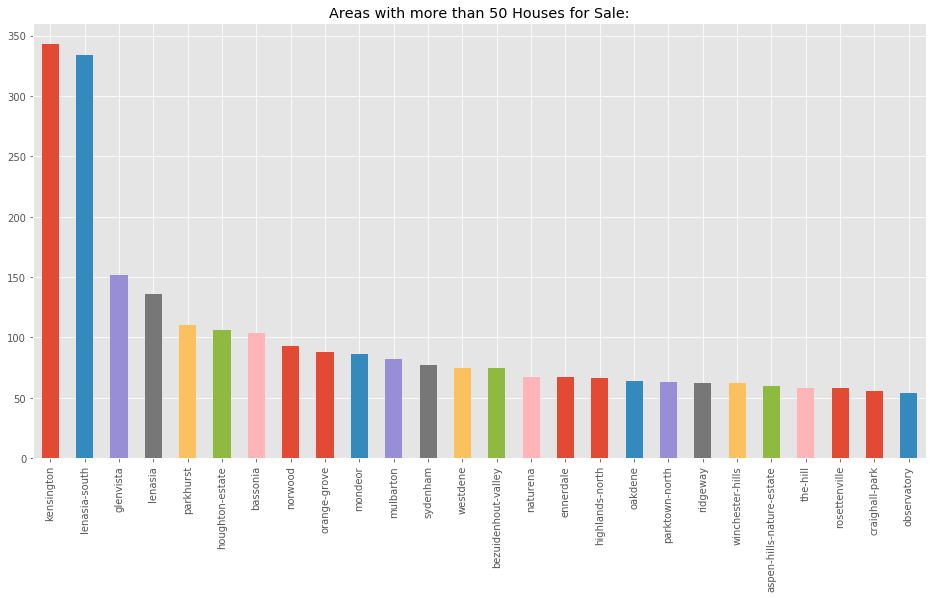
How many Houses are for sale?
(Limiting this to areas that have more than 50 houses for sale, As there are a lot of areas…)
# Value count of the houses in the area
s = pd.value_counts(df["area"])

# We filter s so that there aren't that many names (Areas)
s = s[s > 50]

s.plot.bar(title="Areas with more than 50 Houses for Sale:")
<matplotlib.axes._subplots.AxesSubplot at 0x21c7ce4e198>
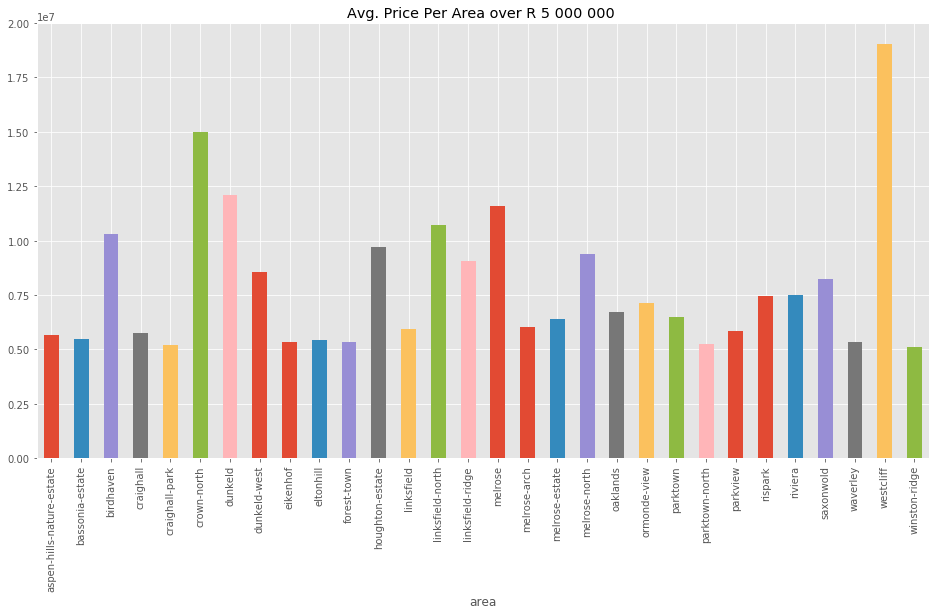
Where can you find the most expensive houses?
s_avg = df.groupby('area')['price'].mean()
s_avg_greater_than5mil = s_avg[s_avg > 5000000] # Areas that have a house average value over R 5 000 000
s_avg_greater_than5mil.plot.bar(title='Avg. Price Per Area over R 5 000 000 ')
<matplotlib.axes._subplots.AxesSubplot at 0x21c7cd41da0>
Does the amount of rooms correlate to the most expensive houses?
Lets Check if the amount of rooms, on average, that a house in a certain area has, correlates with the price in that area.
s = df.groupby('area')['bed'].mean()
s_greaterthan5 = s[s >= 5]
s_greaterthan5.plot.bar(title="Bedrooms per area (More than 5 Rooms)")
<matplotlib.axes._subplots.AxesSubplot at 0x21c7cdb9470>
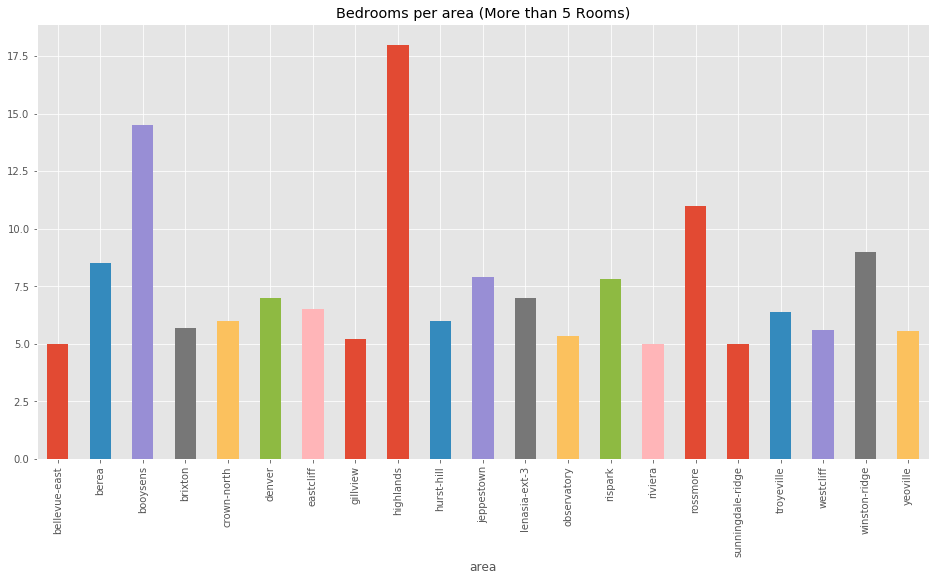
Well that’s interesting?
We see some of the higher values areas… but there’s one that stands out… What’s going on highlands … (That’s a less than good area btw …)
# Lets take a look at what we have for highlands then
df_highlands = df.loc[df['area'] == 'highlands']
df_highlands.head()
| hyperlink | area | name | price | bed | bath |
|---|---|---|---|---|---|
| /for-sale/highlands/johannesburg/gauteng/5924/… | highlands | 18 Bedroom House for sale in Highlands - Johan… | 1399999.0 | 18.0 | 13.0 |
Notes,
We can see we only have one House/flat/investment property thing there… well let’s make sure that this is correct still…
import IPython
house_url = df_highlands.iloc[0]['hyperlink'] # We know there is only one house
url = 'https://www.property24.com' + house_url
#iframe = '<iframe src=' + url + ' width=900 height=350></iframe>'
#IPython.display.HTML(iframe) # Note, this may change
# Not rendering the iframe, creates a weird issue with the notebook. Feel free to look at the URL destination though.
print(url)
https://www.property24.com/for-sale/highlands/johannesburg/gauteng/5924/105243191
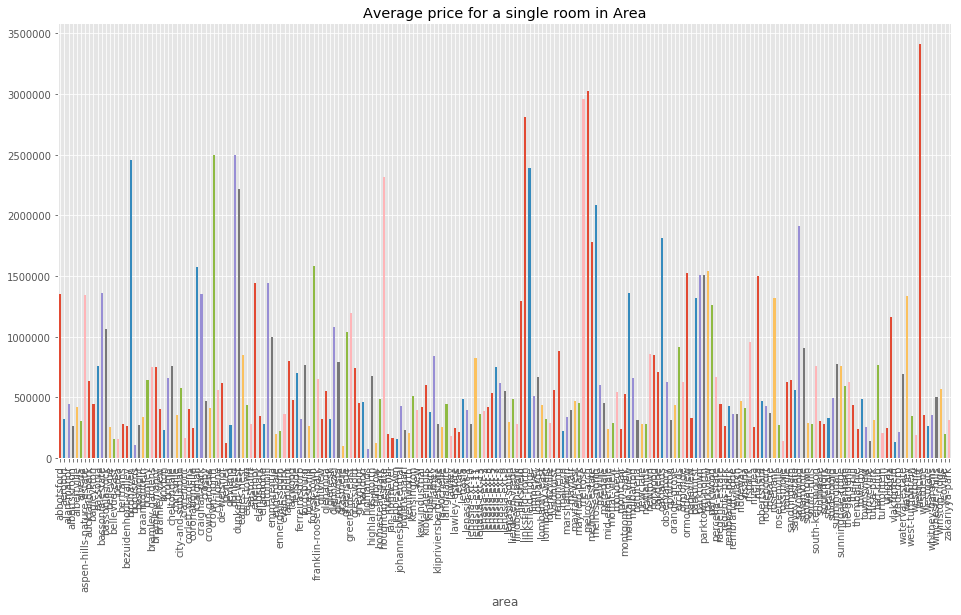
room_cost_per_area = np.divide(s_avg, s)
room_cost_per_area.plot.bar(title="Average price for a single room in Area")
<matplotlib.axes._subplots.AxesSubplot at 0x21c7cfb5f28>
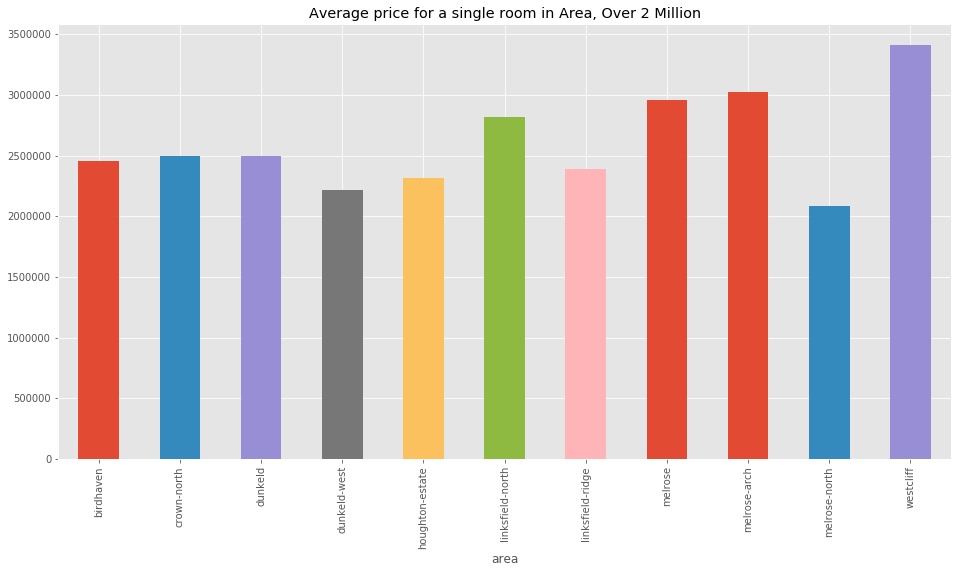
# The houses where the room price is over 2 million
room_costOver2Mil = room_cost_per_area[room_cost_per_area > 2000000]
room_costOver2Mil.plot.bar(title="Average price for a single room in Area, Over 2 Million")
<matplotlib.axes._subplots.AxesSubplot at 0x21c7dc1cef0>
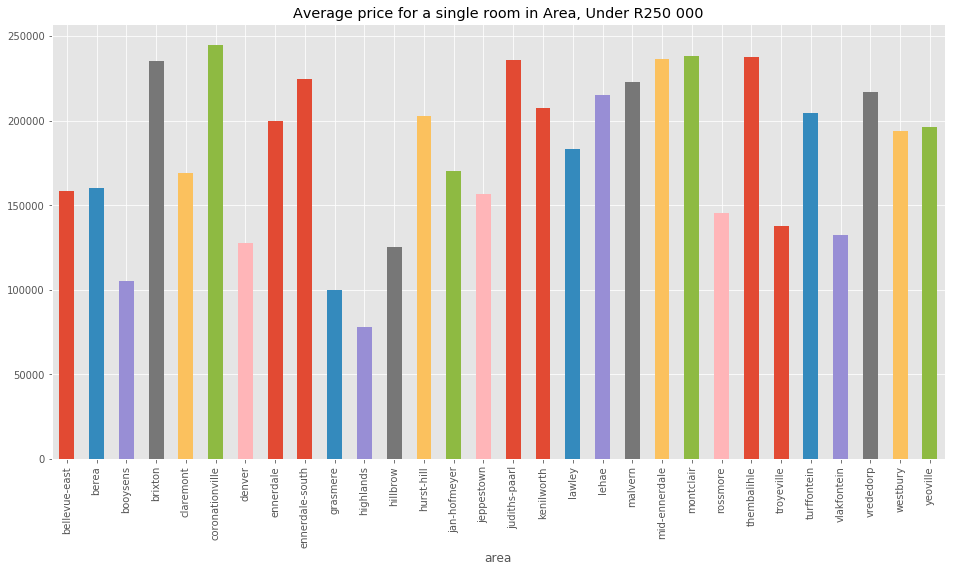
# The houses where the room price is under R250 000
room_costUnderMil = room_cost_per_area[room_cost_per_area < 250000]
room_costUnderMil.plot.bar(title="Average price for a single room in Area, Under R250 000")
<matplotlib.axes._subplots.AxesSubplot at 0x21c7dc97470>